
Testaify’s dashboard centralizes testing intelligence, giving tech leaders both high-level visibility and detailed drill-downs for confident, data-driven decisions.
TABLE OF CONTENTS
How Testaify Works: Monitoring Testing with Testaify's Dashboard
In our previous exploration of providing insights through findings, we examined how Testaify transforms raw testing data into actionable insights. Today, we conclude our series on how Testaify works by diving deep into the heart of your testing operations: the dashboard capabilities that empower tech leaders to make data-driven decisions with confidence.
The Power of Centralized Testing Intelligence
Testaify's dashboard serves as mission control for your entire testing ecosystem, providing tech leaders with the essential information needed to oversee quality assurance operations at scale. Rather than forcing you to piece together information from multiple sources, our dashboard consolidates critical testing metrics into a comprehensive, easy-to-understand interface that tells the complete story of your testing efforts.
The beauty of Testaify's approach lies in its ability to present complex testing data in a format that's immediately actionable. Whether you're preparing for a stakeholder meeting, investigating quality trends, or planning resource allocation, the dashboard provides the high-level perspective you need while maintaining the ability to drill down into granular details when necessary.
High-Level Overview: Your Testing Landscape at a Glance

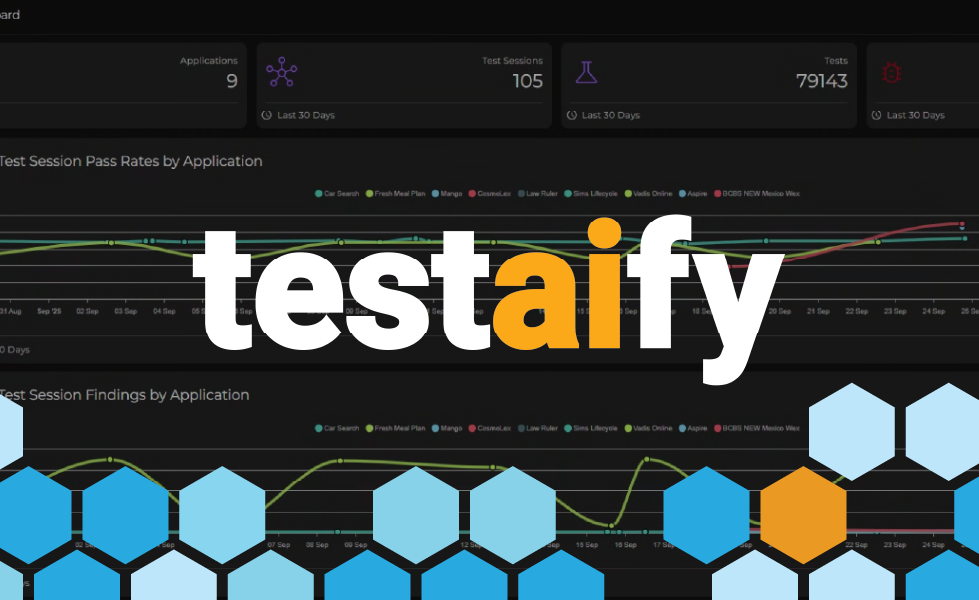
The main dashboard immediately presents four crucial metrics that define the current state of your testing operations. At the top of the interface, you'll find the number of application test environments currently under management, giving you instant visibility into the scope of your testing infrastructure.
The dashboard prominently displays how many test sessions have been completed in the last 30 days, providing immediate insight into your team's testing velocity and activity levels. This metric serves as a pulse check on your testing operations, helping you understand whether your team is meeting expected throughput targets.
Equally important is the count of tests executed in the previous 30 days, which offers a more granular view of testing activity beyond just session completion. This distinction is crucial because a single test session may contain multiple individual tests, and understanding both metrics provides a complete picture of your testing volume.
The final key metric indicates the number of findings reported over the last 30 days. This critical data point immediately indicates the discovery rate of issues within your applications, helping you gauge both the effectiveness of your testing efforts and the stability of your software.
Visual Analytics: Charts That Tell Your Story
Beyond the numerical overview, Testaify's dashboard includes two essential charts that transform raw data into visual insights. The Test Session Pass Rates by Application chart provides an immediate visual comparison of quality across your entire application portfolio. This visualization makes it easy to identify which applications consistently maintain high-quality standards and which may require additional attention or resources.

The Test Session Findings by Application chart complements the pass rate data by showing the distribution of discovered issues across your applications. This chart helps identify patterns in where problems are most commonly found, enabling more strategic allocation of testing resources and development attention.
Application-Level Deep Dive: Granular Insights Where They Matter

When you need to investigate specific applications, Testaify's drill-down capability provides a detailed application dashboard that goes far beyond surface-level metrics. The application-specific view begins with Test Sessions Pass Rates for the last 30 days, giving you a trend analysis of quality over time rather than just a snapshot.
The Latest Test Session section provides immediate access to your most recent testing results, serving as a quick health check for the application. This section provides comprehensive details about the most recent test session, including the session name, execution date, and coverage type, which provides context for the testing approach used.

The granular metrics within the Latest Test Session view provide deep operational insights. You can see the exact number of tests executed, findings discovered, states explored, and transitions tested. The pass rate for this specific session gives you an immediate quality indicator, while the detailed breakdown helps you understand the comprehensiveness of the testing coverage.
Trend Analysis: Understanding Quality Over Time

The application dashboard includes Test Sessions Findings in the last 30 days, presented as a trend analysis that reveals patterns in issue discovery. This temporal view is crucial for understanding whether quality is improving, declining, or remaining stable over time. Sudden spikes in findings may indicate the introduction of new features, introducing complexity, while consistent low numbers suggest stable, well-tested code.
The Test Sessions Duration chart for the last 30 days provides insights into testing efficiency and complexity. Tracking duration trends helps identify when tests are taking longer than usual, which could indicate increased application complexity, performance issues, or the need for test optimization. This metric is essential for capacity planning and resource management.
Empowering Data-Driven Decisions
Testaify's dashboard capabilities transform testing from a reactive process into a strategic advantage. By providing both high-level overviews and detailed drill-down capabilities, tech leaders can quickly assess overall quality posture while maintaining the ability to investigate specific concerns in depth.
The combination of real-time metrics, trend analysis, and comparative visualizations ensures that every decision about testing strategy, resource allocation, and quality improvement is backed by comprehensive data. This level of insight enables proactive quality management, helping teams identify and address potential issues before they impact users.
With Testaify's dashboard as your command center, monitoring testing becomes not just about tracking what happened, but about understanding what it means for your organization's quality objectives and what actions to take next. This information is how modern testing operations achieve both efficiency and excellence.
About the Author
 Testaify founder and COO Rafael E. Santos is a Stevie Award winner whose decades-long career includes strategic technology and product leadership roles. Rafael's goal for Testaify is to deliver comprehensive testing through Testaify's AI-first platform, which will change testing forever. Before Testaify, Rafael held executive positions at organizations like Ultimate Software and Trimble eBuilder.
Take the Next Step
Testaify is in managed roll-out. Request more information to see when you can bring Testaify into your testing process.